Homeostasis in Animals

AUSTRALIAN CURRICULUM ALIGNMENT
- Conduct investigations, including using models of homeostasis and disease transmission, safely, competently and methodically for valid and reliable collection of data (ACSBL098)
- Represent data in meaningful and useful ways, including the use of mean, median, range and probability; organise and analyse data to identify trends, patterns and relationships; discuss the ways in which measurement error, instrumental accuracy, the nature of the procedure and sample size may influence uncertainty and limitations in data; and select, synthesise and use evidence to make and justify conclusions (ACSBL099)
BACKGROUND
An animal’s survival depends on its ability to maintain a stable internal environment that enables individual cells to function properly. Homeostasis is the maintenance of “normal” or steady state conditions within the body. In most animals, an internal transport system plays a major role in homeostasis. The circulatory system delivers nutrients, oxygen, and hormones to the interstitial fluid (fluid between cells) and removes waste. The circulatory system therefore provides cells with the raw materials they need to perform their functions, while also ridding the cells of potentially toxic by-products. Like other body systems, the circulatory system is influenced by negative and positive feedback. When negative feedback occurs, the nervous system responds to the stimulus by signalling the circulatory system to minimize or reverse its effects. When we exercise vigorously our muscles use more oxygen than normal. Heart rate must speed up to accommodate the increased need for oxygen. However, as the body recovers from periods of strenuous exercise, mechanisms within the body work to return the heart rate back to its resting set point, or normal range of physiological values. The body uses self-correcting actions (known as negative feedback mechanisms) to stabilise a body system and return internal conditions to a steady state (homeostasis).This practical introduces the concept of homeostasis and allows students to experience it first hand. In this practical, students will exercise and monitor their body conditions as they begin to recover. Students are required to act as the test subject and gather data on their peers. To reinforce their understanding of homeostasis, students are tasked with graphing and interpreting the data based on their negative feedback mechanisms. This is an excellent opportunity for students to observe how feedback mechanisms maintain homeostasis in animal
METHOD - STUDENT ACTIVITY
- Select a partner or form a group of 4.
- Determine the resting heart rate of you and your partner/group members by taking each pulse on their wrist 3 times for 15 seconds.
- Determine the average by adding the 3 resting pulse rates and dividing by 3.
- Run vigorously in place for 2 minutes (use a timer to ensure accuracy).
- Measure pulse rate for 15 seconds immediately after running.
- Measure the pulse again for 15 seconds then switch to intervals of one minute for a total of 5 minutes.
- Record each group member’s heart rate after exercise and compare the results.
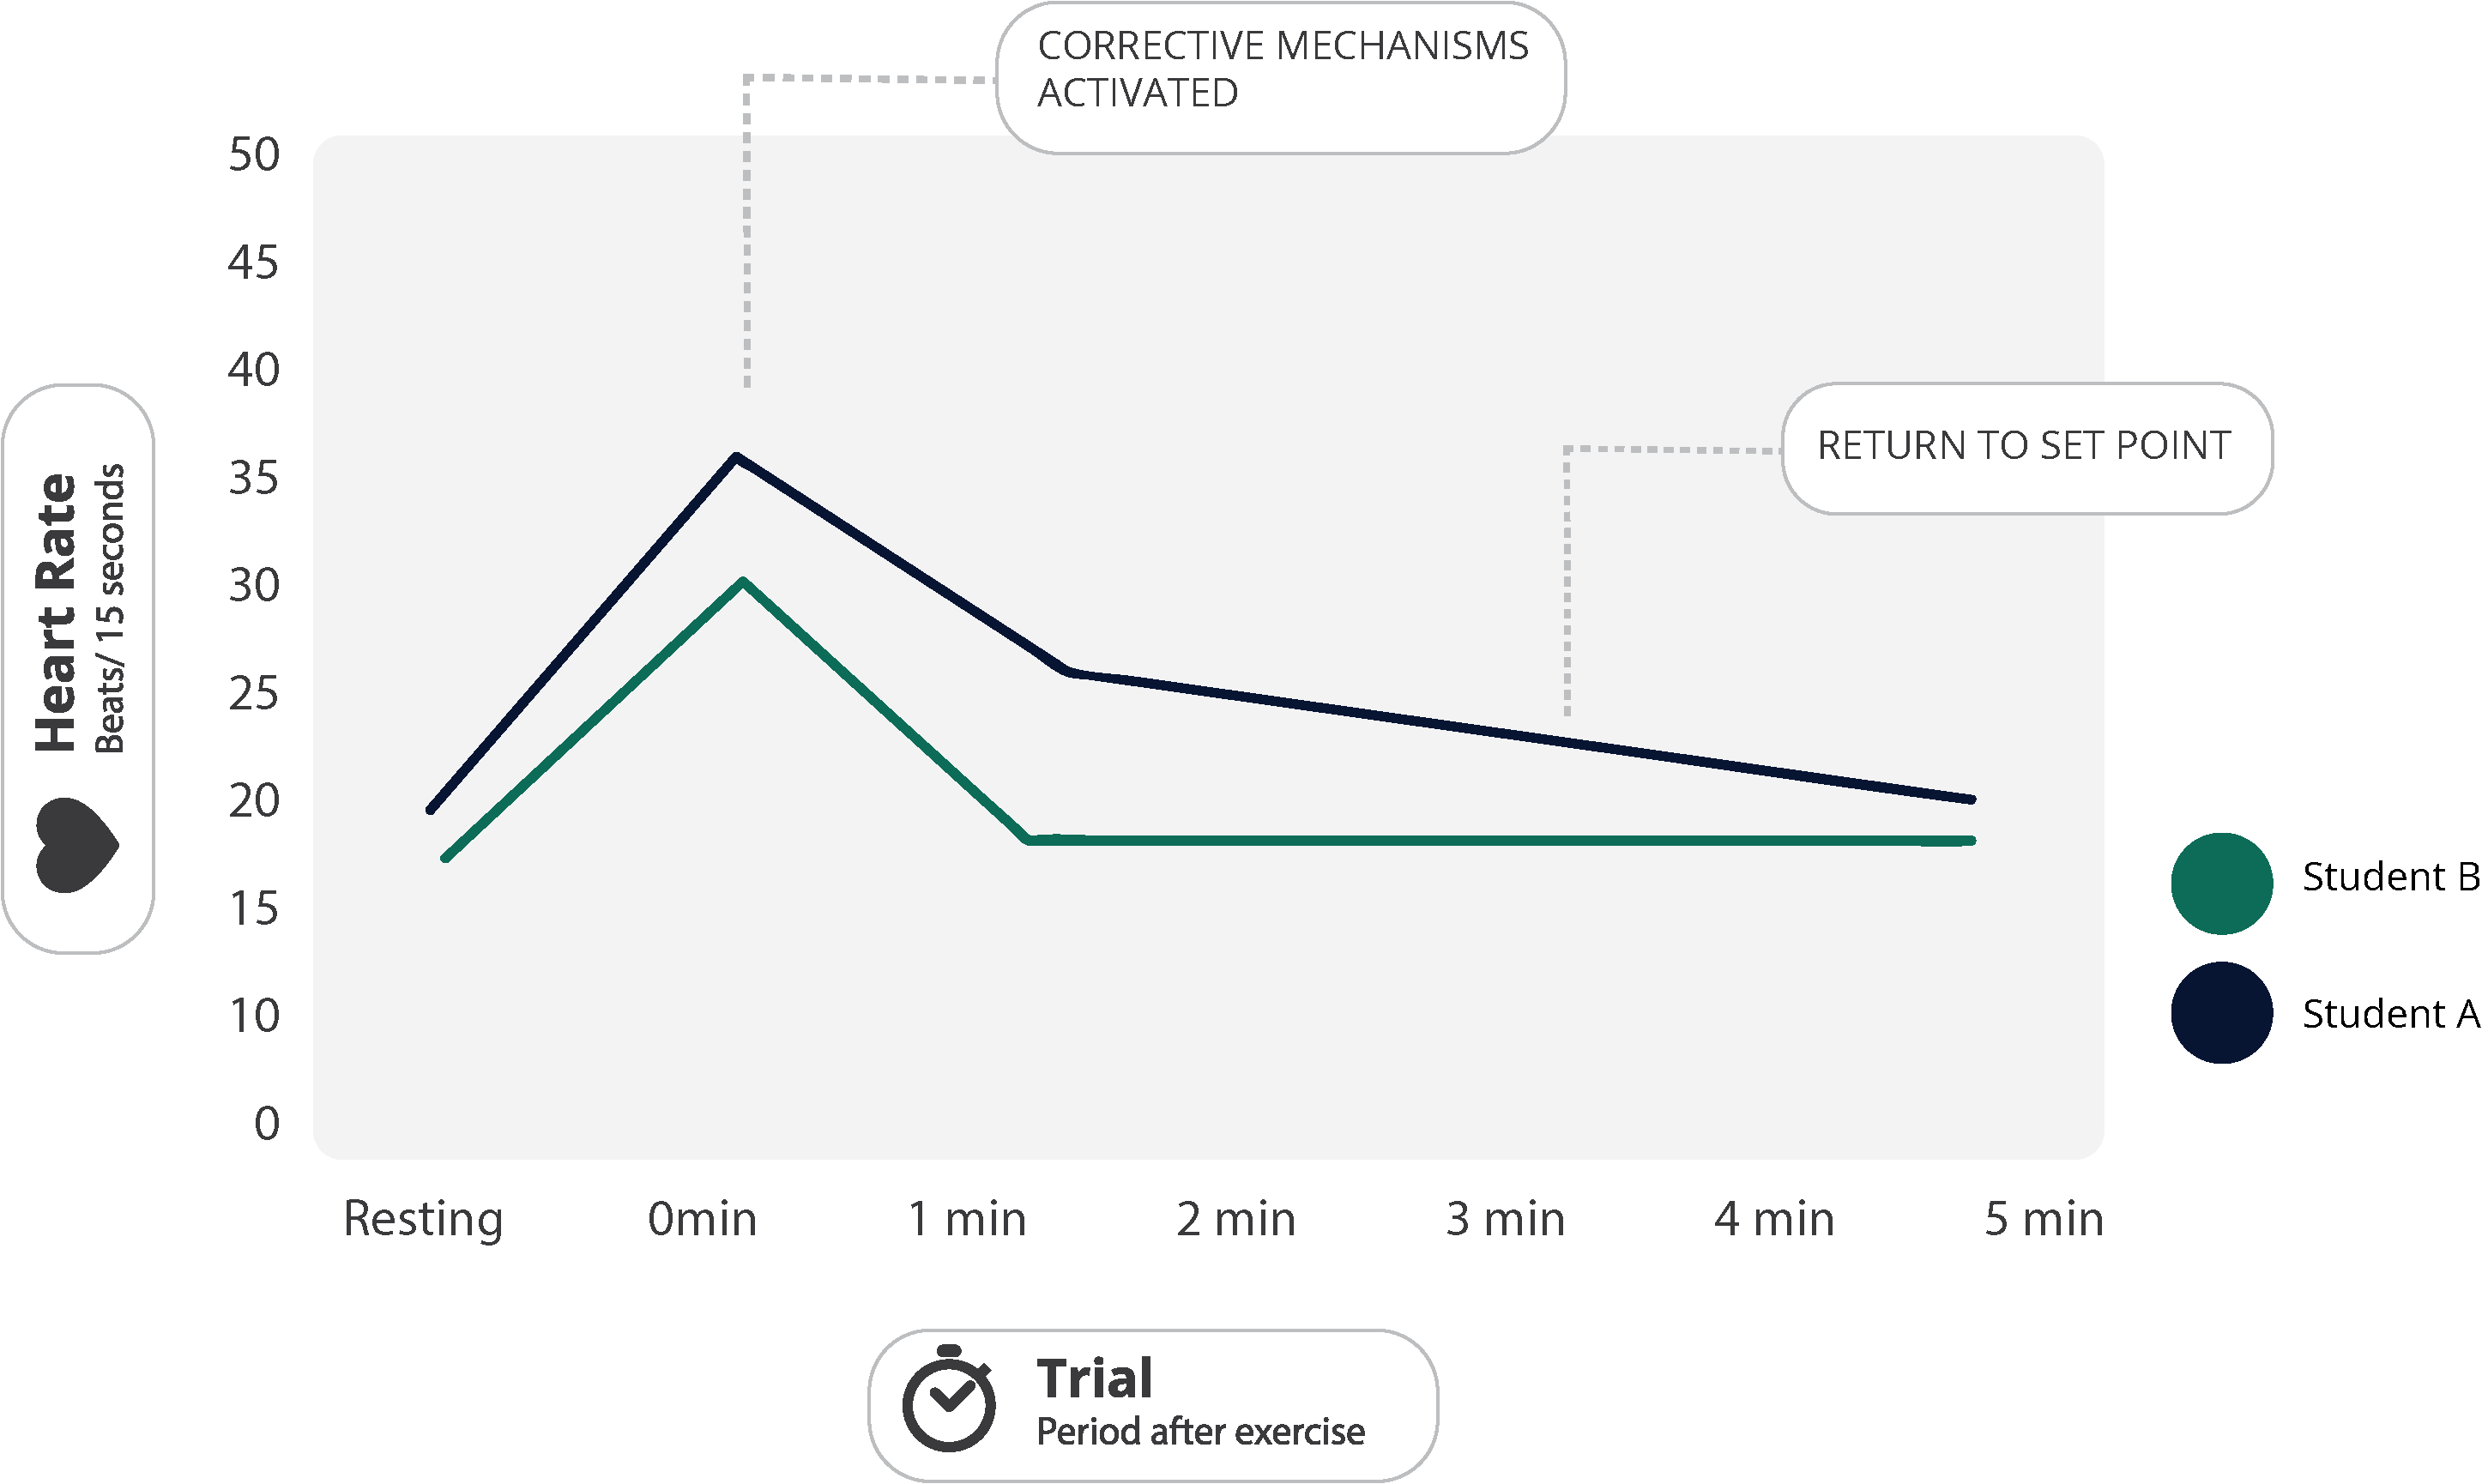
- Draw a graph of both of your average resting heart rate and post- exercise heart rates (on the same axes). Plot these data sets on the same axes, and include units. Use a different colour pen to draw the line for each test subject and include a key. Mark the set point, where exercise is taking place, and where corrective mechanisms are activated.
OBSERVATION AND RESULTS
Below is an example result of a group of heart rates at rest. This is to be used as a guide only as individual results will vary. The normal range is generally considered between 60-100 beats per minute.

Below is an example of expected results for heart rates after exercise. This is to be used as a guide only as individual results will vary.

Below is an example data set of every group member’s average resting heart rate and post-exercise heart rates graphed using a time interval of 5 minutes.

INVESTIGATIONS
-
Ask students to describe each segment on the graph using the concepts of homeostasis and negative feedback mechanisms.
- Ask students to consider whether the graph would change if you collected data for a positive feedback mechanism.
- Task students with converting their heart rates to beats/minute and comparing them to the normal range of 60 to 100 beats/minute.
 Time Requirements
- 30 mins
 Material List
- Stopwatch
 Safety Requirements
- Wear appropriate personal footwear when running to avoid injury.
- Be mindful of any physical restrictions or considerations when engaging in physical activities.
